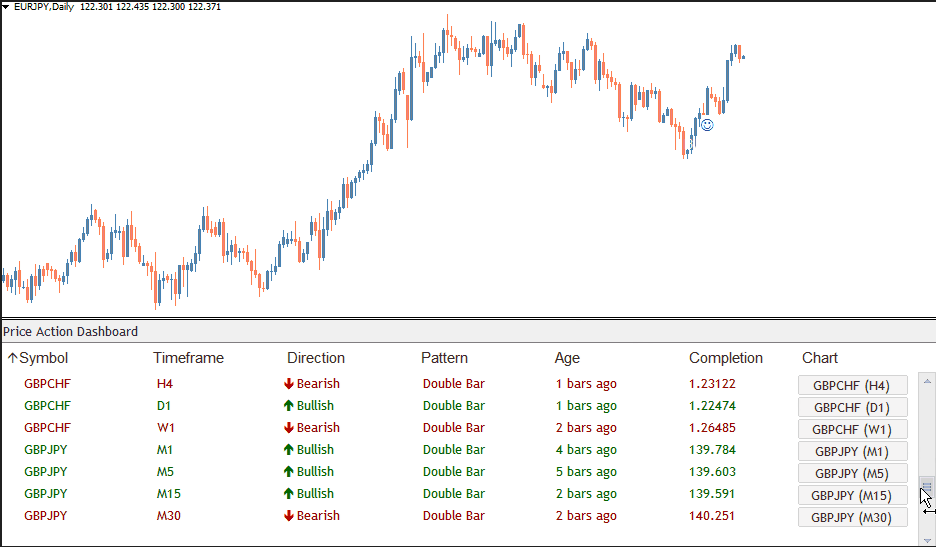
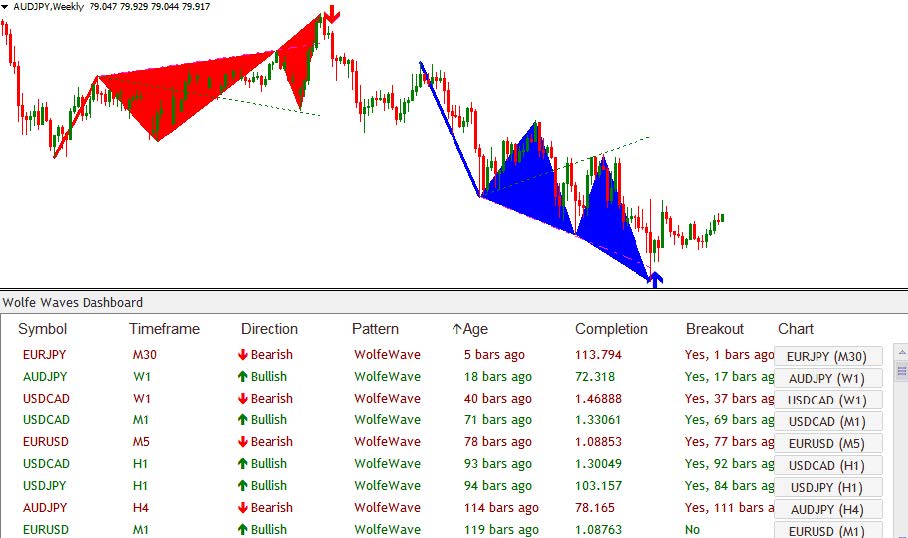
The name says it all. This "Price Action Dashboard" scans all currency pairs and all time-frames for 5 powerful price action patterns that have the greatest probability of winning:
- Pin Bar
- Double Bar High Lower Close
- Double Bar Low Higher Close
- Bearish Outside Vertical Bar
- Bullish Outside Vertical Bar
The indicator also displays a beautiful dashboard on your chart where you can see exactly what price action pattern has recently formed on EVERY pair, EVERY time frame.
With just one look at the dashboard, you’ll instantly know all the information you need to make a good trading decision. You’ll instantly know which pattern appears on every time frame (from 1 minute to monthly) and on every currency pair.
Not only that, you’ll also know the exact direction of that pattern – whether it’s bullish or bearish. And you’ll know exactly how long ago that particular pattern showed up.
Remember, you can specify as many pairs as you like. You can also use it for indices, stocks, futures, and gold (anything your broker offers in Metatrader). Our Price Action Dashboard takes care of it all.
And you’re in total control. You can specify which currency pairs and which time frame you want the indicator to scan for Price Action patterns.