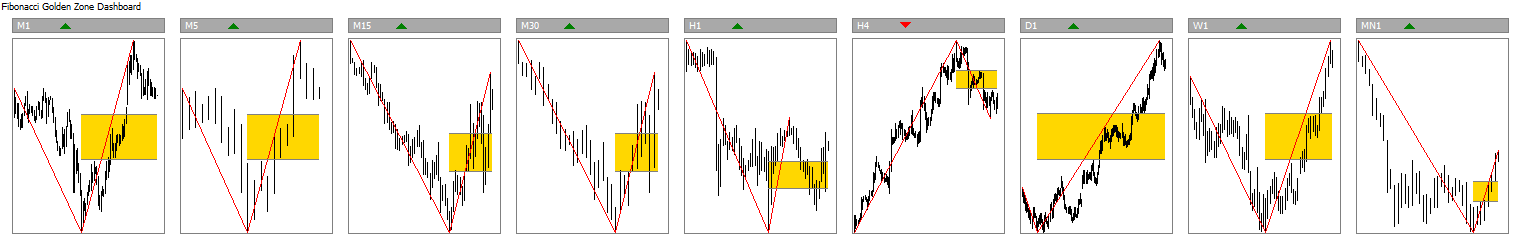
Fibonacci Golden Zone
Items Sold Count: 261
Available quantity: 3
Type: Indicator • Trading Tool • Trading System
Platform: MetaTrader 4 (MT4) • MetaTrader 5 (MT5) • NinjaTrader 7 • NinjaTrader 8
Language: English
Markets: All markets/assets in your trading platform
Trading Style: Fibonacci Trading • Trend and Counter Trend Trading
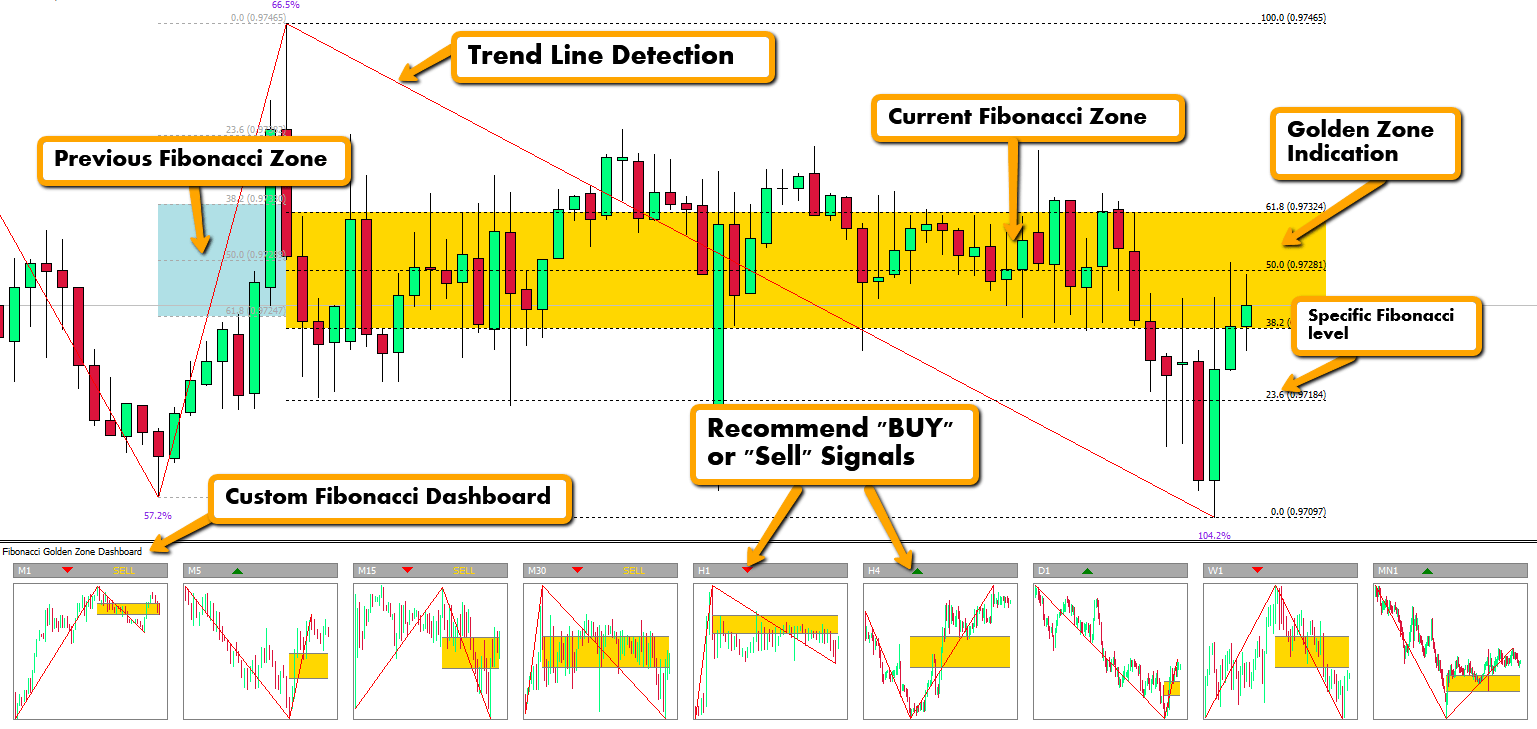
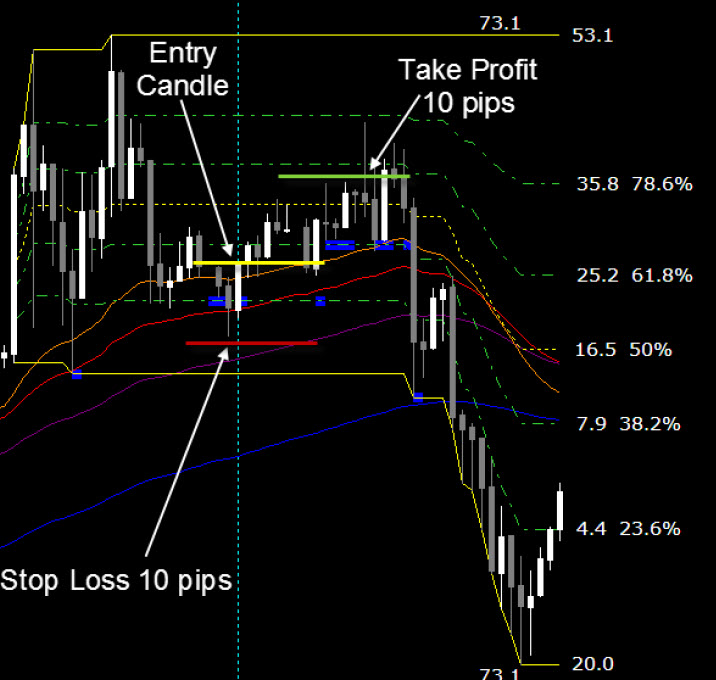
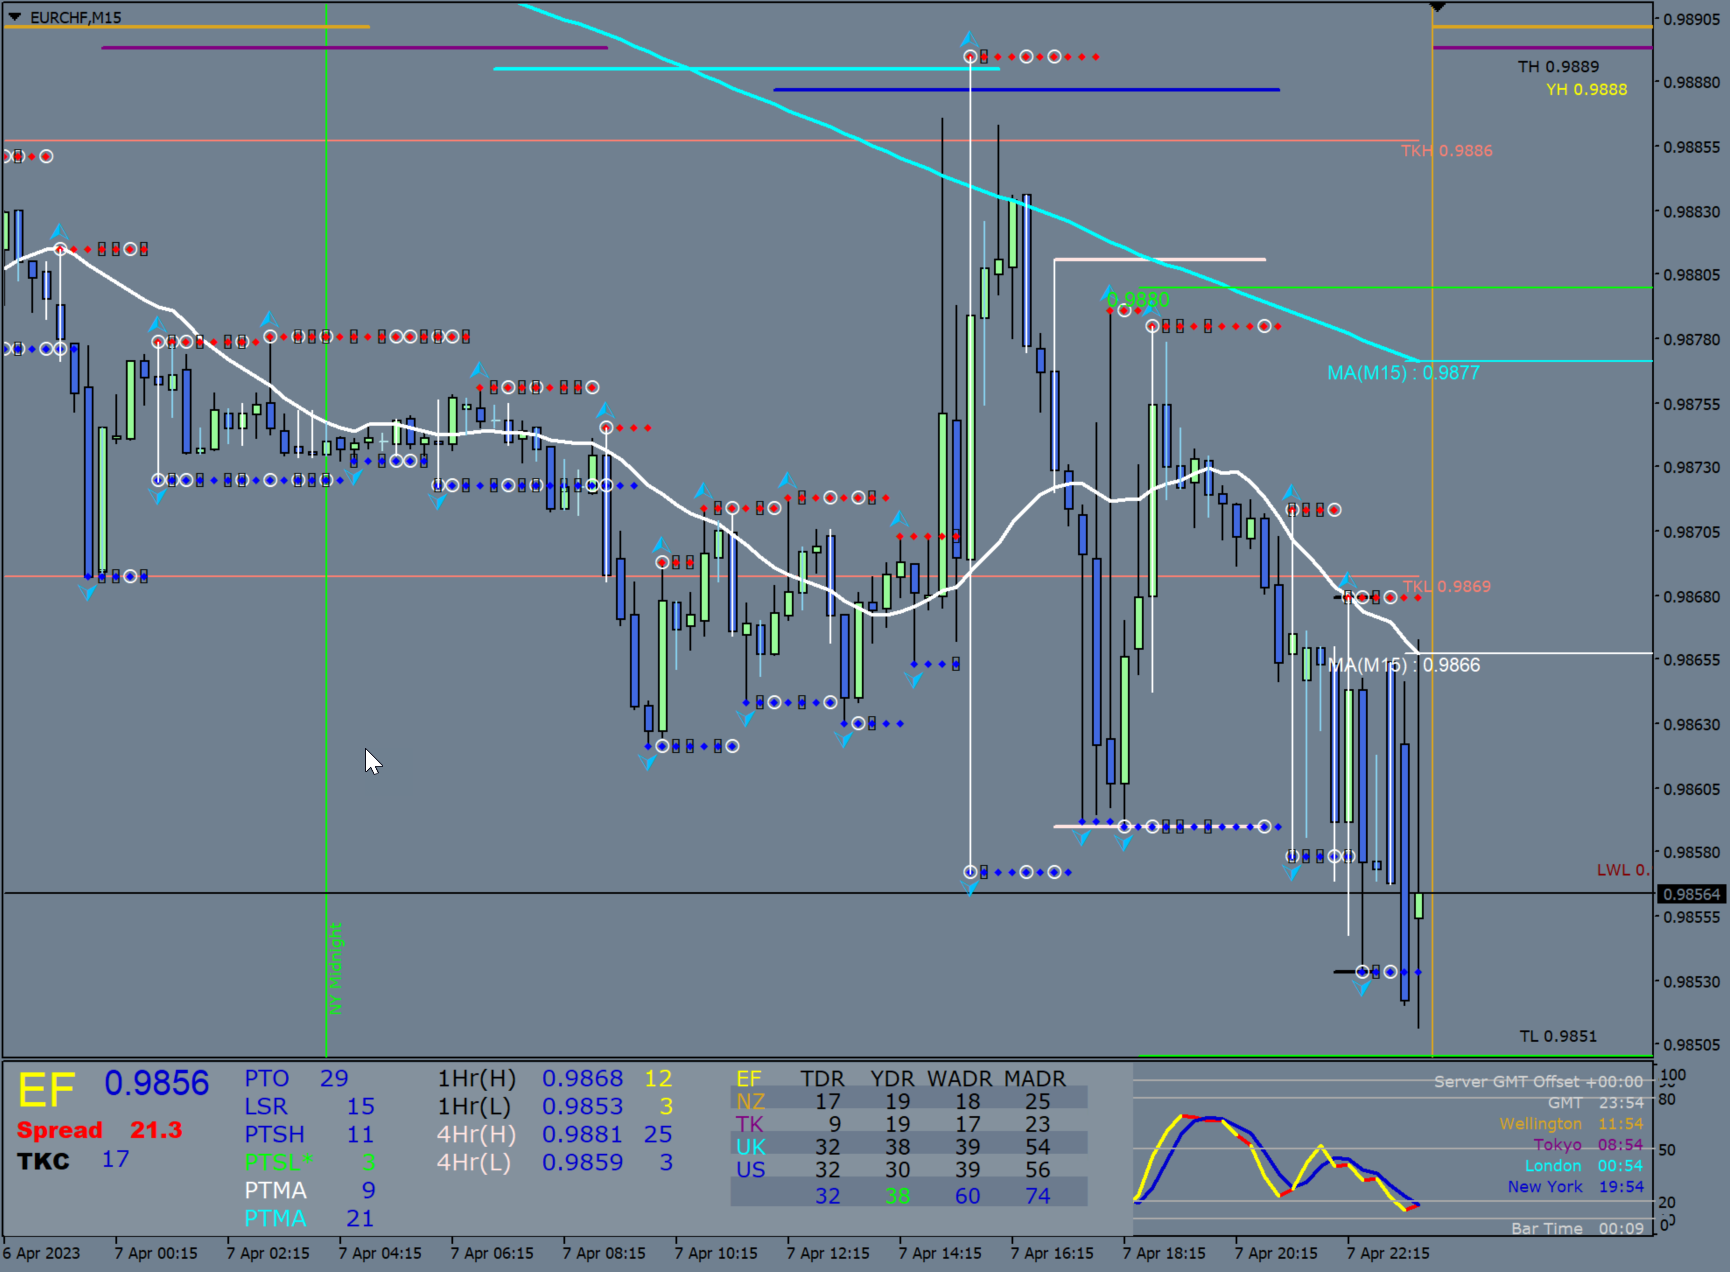
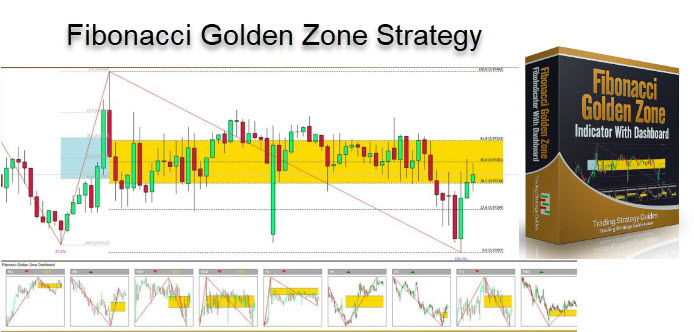
Fibonacci Golden Zone Strategy is an automatic Fibonacci indicator & system. This indicator covers all of the untold power of the Fibonacci sequence.
Never Again Will You Have To Spend Hours Manually Drawing and Deleting Fibonacci Levels on Your Charts. The Problem is that Very Few know How to Draw Fibonacci Lines the right way – Fibonacci Golden Zone Indicator will Stop this Madness Once and For All by automatedly doing it for you
This indicator covers all of the untold power of the Fibonacci sequence in the strategy like, what each fibo line represents, what to do if there is no retracement of the trend, where your fibo lines should be going, and so much more.