Price: US $60
BIG SALE
Price: US $30.00 US $60 - 50%
INSTANT DOWNLOAD
Gifts
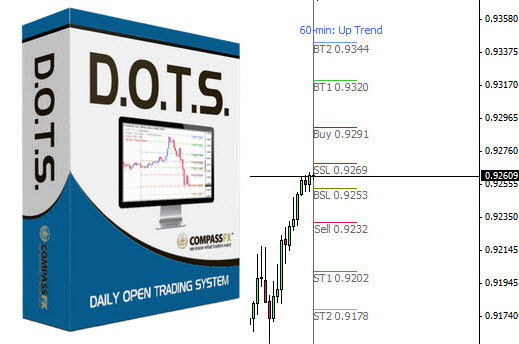
The D.O.T.S. Method
Items Sold Count: 524
Available quantity: 3
Type: Trading System • Indicator • Trading Tool • Course
Platform: MetaTrader 4 (MT4)
Operating System: Windows
Language: English
Markets: All markets/assets in your trading platform
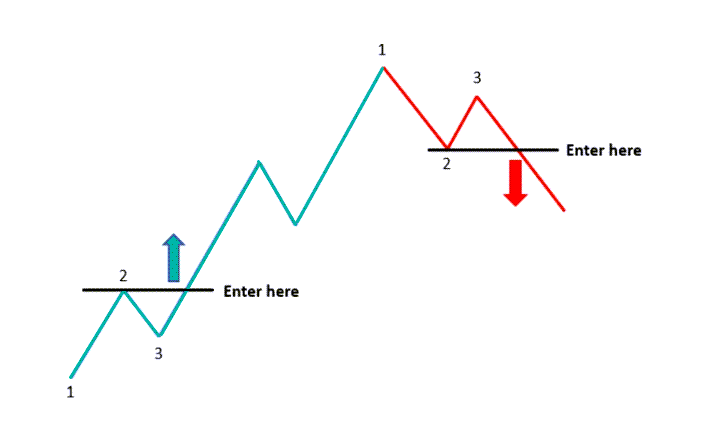
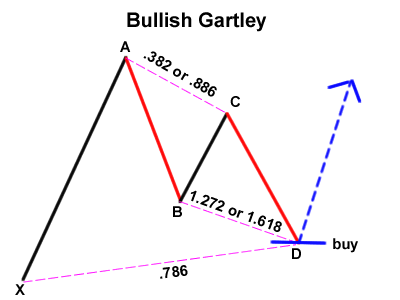
Trading Style: Trend Trading • Moving Averages Trading • Price Action Trading
D.O.T.S. (Daily Open Trading System) was designed to be an all-in-one system.
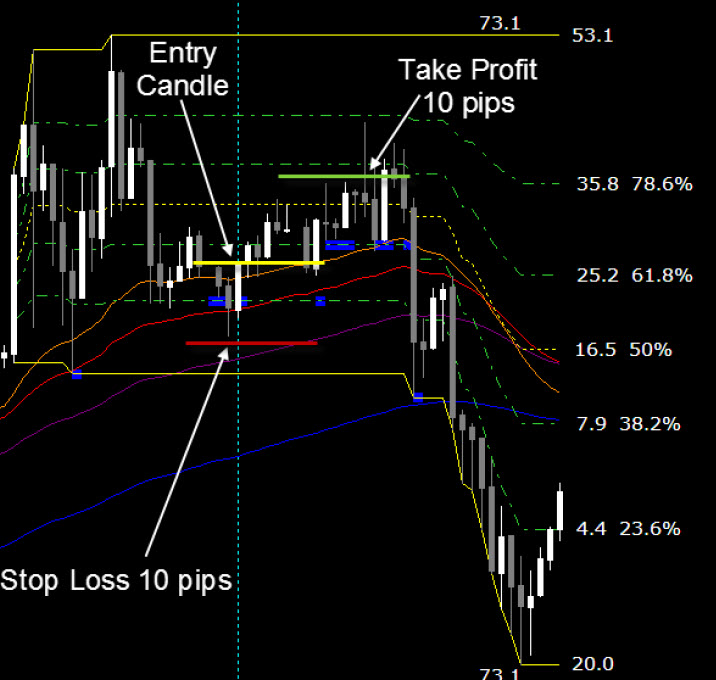
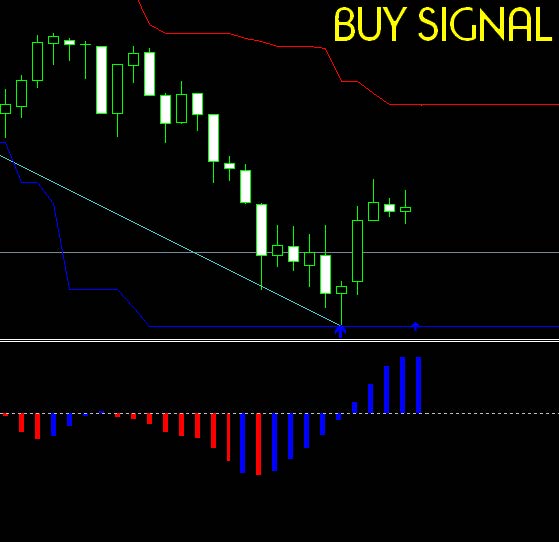
The D.O.T.S. Method Indicator is a stand-alone trading system built into one indicator that identifies Entries, Exits, and Targets at the Open of the Day.
D.O.T.S. is a price-based indicator that calculates potential market price levels based on daily and historical market movement.
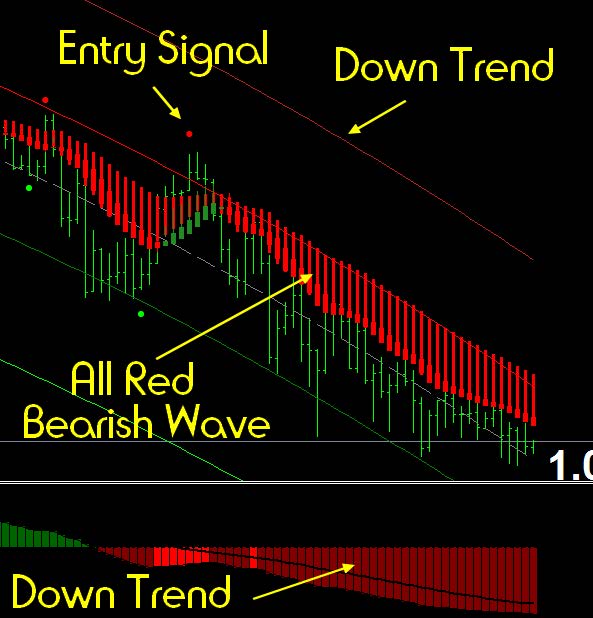
The most recent update also shows the trend direction which you can use as a trade filter.
The package includes indicators, manuals, and more than 12 hours of training videos.